West Indies vs New Zealand Preview – T20 Internationals 2026 | Statz
16th July 2026
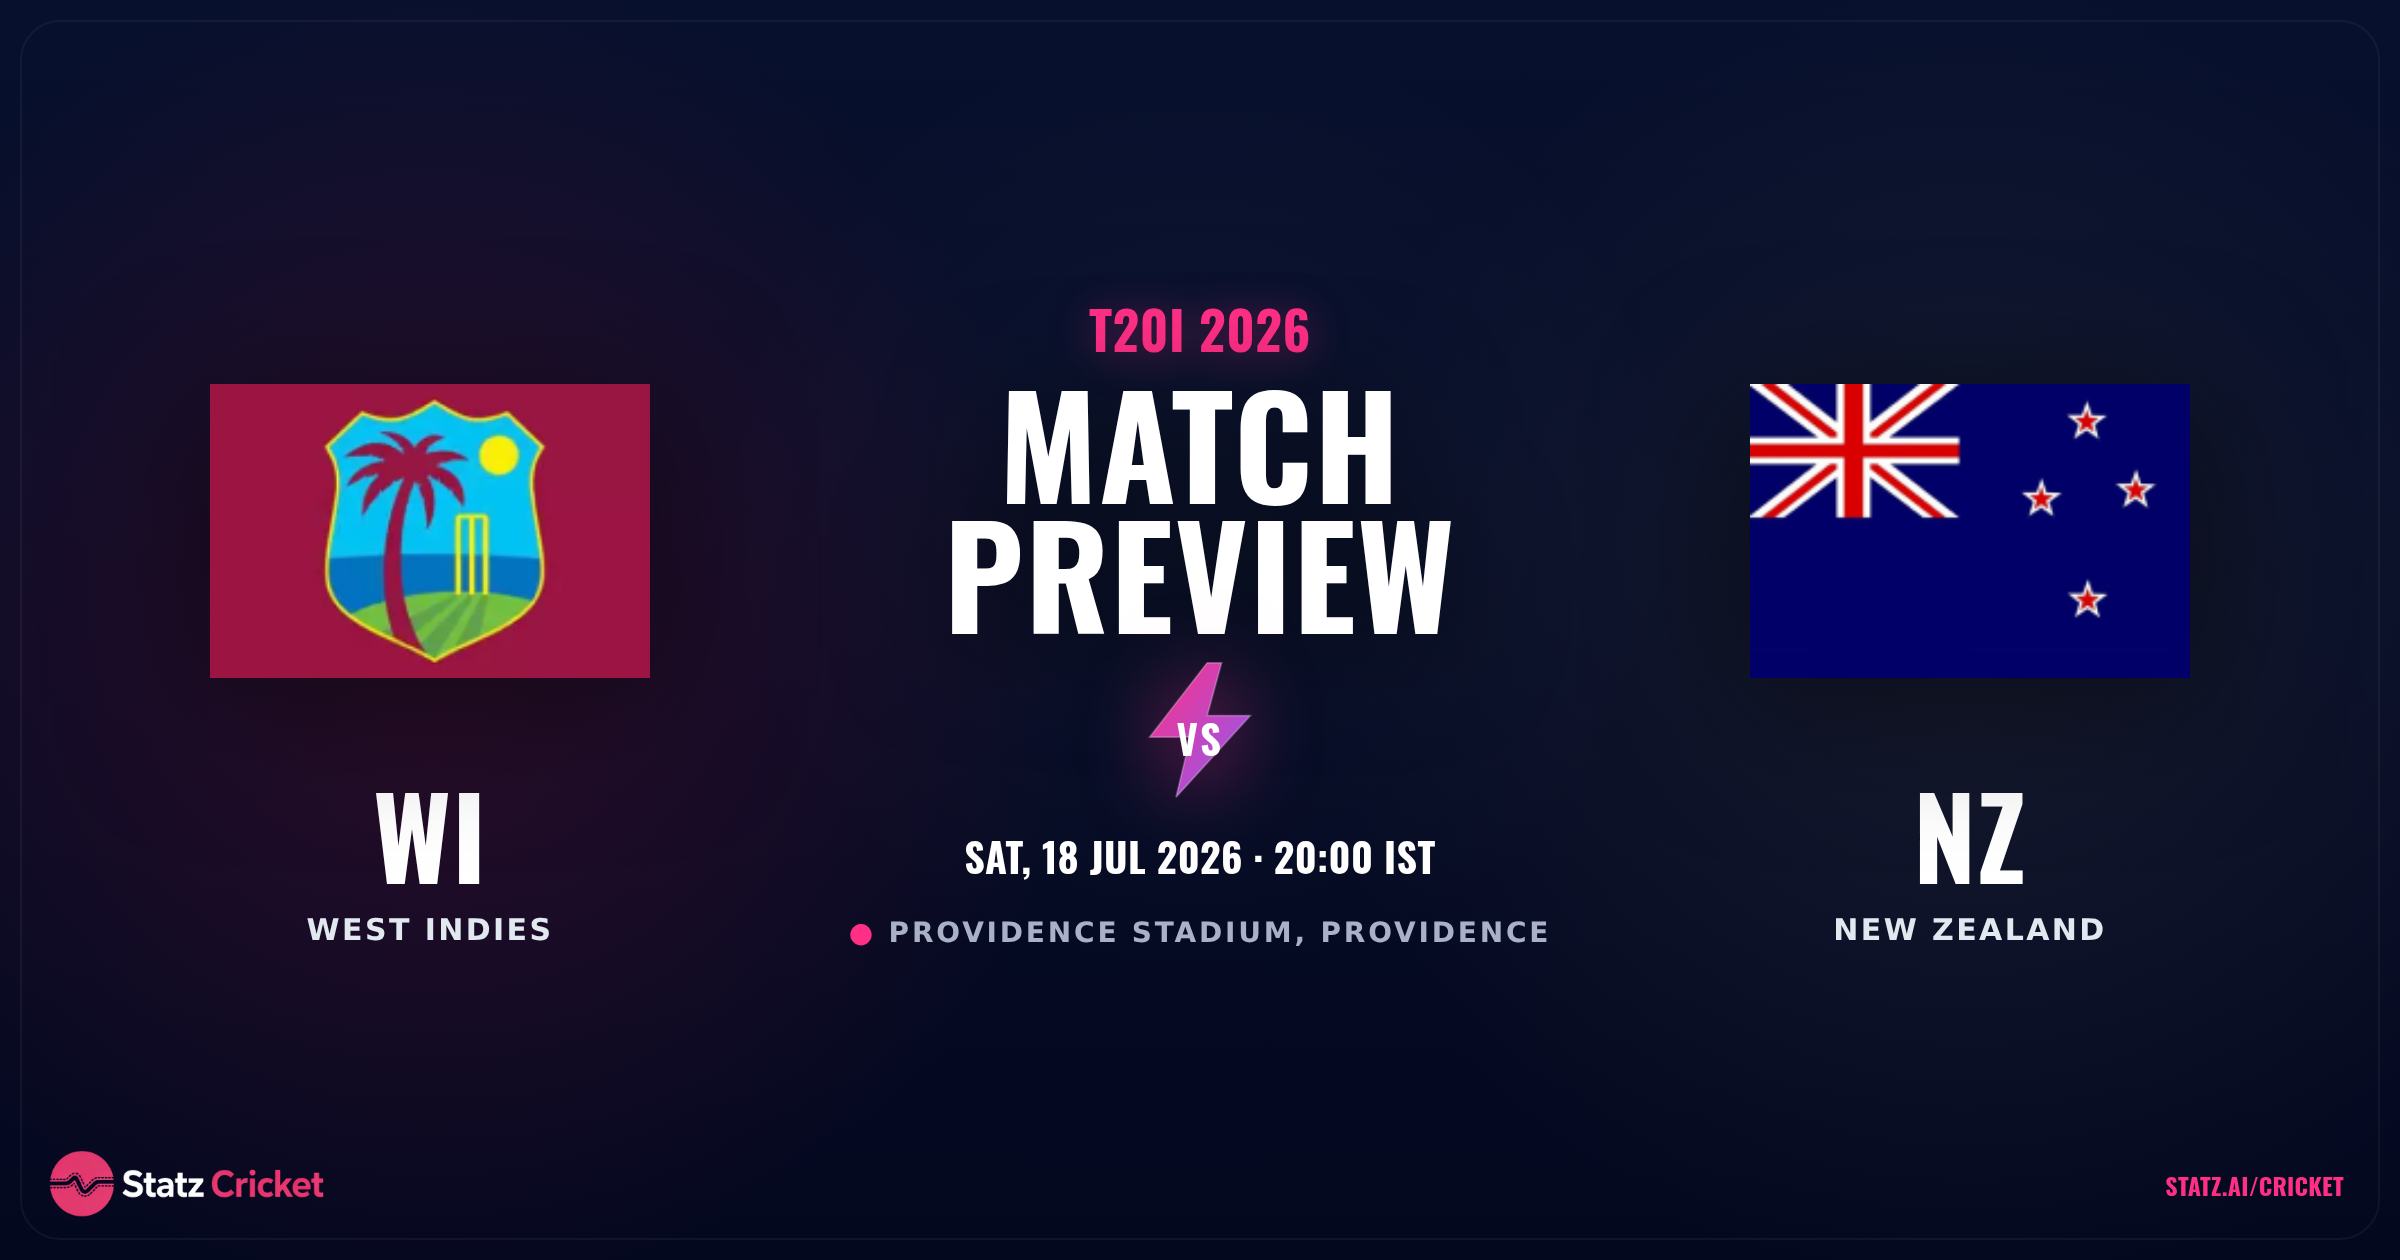
West Indies face New Zealand at Providence Stadium on Saturday in a T20 International clash with both sides looking to climb the ICC rankings. First ball is at 14:30 UTC on 18 July 2026.
The West Indies sit 7th in the ICC T20I rankings with a rating of 234, while New Zealand occupy 4th spot on 247 – a gap of 13 rating points that underscores the quality difference on paper. For full match data, head-to-head records and live projections, check the West Indies vs New Zealand fixture page on Statz.
The Venue
Providence Stadium in Guyana has hosted just seven T20 matches in the available data, but the picture is clear: this is a bowler-friendly surface. The average match total across those seven games stands at 230 runs, with an average first-innings score of just 155.4. Seam bowlers have dominated, taking 59.3% of wickets at an economy rate of 8.61, while spinners have been even more economical at 7.4 but account for 31.5% of dismissals.
The ground itself is tagged as Bowler friendly by Statz. West Indies have won 4 of 8 T20s here since 2021, with an average score of 19.2 – a modest return that reflects the pitch’s restrictive nature. New Zealand have played just once at Providence in T20 cricket, losing to Glenn Phillips scoring 18 in a chase.
Form and ICC Rankings
West Indies – 7th (Rating 234, 13,079 points from 56 matches)
The home side have had a mixed run of late. Their last five T20I outings show two wins and three losses, with recent form reading: W vs Sri Lanka (170/5 chasing 169), L vs Sri Lanka (157/10 losing to 194/6), W vs Sri Lanka (149/3 chasing 147/9), L vs India (195/4 losing to 199/5), L vs South Africa (176/8 losing to 177/1). Inconsistency has been the hallmark – they can compete with the best but lack the consistency to string wins together.
New Zealand – 4th (Rating 247, 12,348 points from 50 matches)
New Zealand are the higher-ranked side and their recent form backs that up. From their last five T20Is: W vs Bangladesh (104/4 chasing 102/10 in 11.4 overs), NR vs Bangladesh, L vs Bangladesh (182/6 losing to 183/4), L vs South Africa (154/8 losing to 187/4), L vs South Africa (145/10 losing to 164/5). Like West Indies, they have struggled for consistency, but their ranking reflects a stronger overall body of work across the ICC calendar.
Head-to-Head Record
New Zealand hold a commanding advantage in this fixture. From 14 T20I meetings, New Zealand have won 9 to West Indies’ 2, with 3 no-results. The last five clashes have gone: L, NR, L, L, W for West Indies – a dire sequence that shows New Zealand’s dominance. The Statz projections and verdict reflect this historical imbalance.
Statz Projections
The Statz projections make New Zealand clear favourites in this contest.
If West Indies bat first: Projected first-innings total of 157.1, match total of 304.6. Win probability – WI 42.2%, NZ 55.8%. First-innings P10-P90 range: 134 to 181.
If New Zealand bat first: Projected first-innings total of 156.7, match total of 303.9. Win probability – WI 48.2%, NZ 49.8%. First-innings P10-P90 range: 134 to 180.
Both projected match totals sit above the Providence Stadium average of 230, suggesting the Statz model rates both batting lineups above the venue’s historical standard. However, the projected first-innings totals of around 157 align closely with the ground average of 155.4 – expect a tight contest in the powerplay and middle overs.
Competition Season Leaders
T20I Runs – Top 5
- Karanbir Singh (Austria) – 591 runs from 12 innings
- Abhishek Sharma (India) – 363 runs from 12 innings
- Ishan Kishan (India) – 350 runs from 11 innings
- Shimron Hetmyer (West Indies) – 318 runs from 9 innings
- Harry Brook (England) – 285 runs from 8 innings
T20I Wickets – Top 5
- Amjad Sher (Finland) – 18 wickets from 10 innings
- Arshdeep Singh (India) – 16 wickets from 10 innings
- Bilal Zalmai (Austria) – 15 wickets from 12 innings
- Shahid Afridi (Germany) – 15 wickets from 9 innings
- Matthew Humphreys (Ireland) – 14 wickets from 7 innings
West Indies Season Leaders
Runs: Shimron Hetmyer – 318 runs, avg 35.33, HS 75 | Brandon King – 232 runs, avg 29.0, HS 50 | Sherfane Rutherford – 131 runs, avg 26.2, HS 57
Wickets: Shamar Joseph – 13 wickets, avg 1.86, best 5 | Matthew Forde – 8 wickets, avg 0.89, best 2 | Jason Holder – 5 wickets, avg 1.0, best 3
New Zealand Season Leaders
Runs: Glenn Phillips – 176 runs, avg 35.2, HS 78 | Devon Conway – 164 runs, avg 23.43, HS 60 | Mitchell Santner – 140 runs, avg 17.5, HS 47
Wickets: Ben Sears – 10 wickets, avg 1.67, best 3 | Mitchell Santner – 10 wickets, avg 1.25, best 3 | Kyle Jamieson – 8 wickets, avg 1.0, best 2
Predicted XIs
West Indies (based on most recent XI)
- Brandon King
- Shai Hope (c, wk)
- Shimron Hetmyer
- Rovman Powell
- Sherfane Rutherford
- Roston Chase
- Ackeem Auguste
- Jason Holder
- Matthew Forde
- Akeal Hosein
- Shamar Joseph
New Zealand (based on most recent XI)
- Katene Clarke
- Tim Robinson
- Dane Cleaver (wk)
- Nick Kelly (c)
- Bevon Jacobs
- Dean Foxcroft
- Josh Clarkson
- Nathan Smith
- Ish Sodhi
- Jayden Lennox
- Ben Sears
These lineups are based on the most recent matches for each team. Always check the fixture page on Statz for toss updates and confirmed XIs on match day.
Key Players
Shimron Hetmyer (West Indies)
The West Indies’ standout performer this season with 318 runs at an average of 35.33. Hetmyer has hit 25 sixes and 23 fours in just 9 innings – a strike rate that speaks to his aggressive intent. His last three scores of 36, 32 and 17 show consistent run-scoring, and he carries a 66.7% hit rate for 20+ runs this season, climbing to 80% in his last five matches. On a bowler-friendly pitch, his ability to manufacture boundaries will be crucial for West Indies.
Shamar Joseph (West Indies)
The West Indies’ premier fast bowler with 13 wickets from 6 matches this season – an average of 1.86 per game. Joseph has taken 5 wickets in a single match and carries a 71.4% hit rate for 1+ wicket this season, climbing to 80% in his last five outings. His last three returns of 5, 3 and 3 wickets show he is in excellent form. On a surface that favours seam bowling, Joseph will be West Indies’ best hope of restricting New Zealand’s batting.
Ben Sears (New Zealand)
New Zealand’s leading wicket-taker with 10 wickets from 6 matches this season at an average of 1.67 per game. Sears has taken 2+ wickets in 66.7% of his matches this season, and that rate climbs to 80% in his last five outings. His last three returns of 2, 2 and 1 wickets show consistent penetration. On a bowler-friendly pitch, Sears could be the difference-maker for New Zealand’s attack.
Roston Chase (West Indies)
The all-rounder projects for 23.2 runs and 0.65 wickets in the Statz model when West Indies bat first – a dual-threat profile that makes him invaluable in the middle order. Chase has 72 runs and 5 wickets from 4 matches this season, providing balance that West Indies will need against New Zealand’s quality bowling attack.
Dream11 Tips – Captain and Vice Captain
Captain: Jason Holder (West Indies) – projected 110 fantasy points when West Indies bat first. The all-rounder offers value across batting and bowling, with projected 15.8 runs and 1.6 wickets. His experience in T20 cricket and ability to contribute in multiple ways makes him the safest captain choice.
Vice Captain: Mitchell Santner (New Zealand) – projected 85.3 fantasy points when New Zealand bat first. The left-arm spinner has 140 runs and 10 wickets this season, providing genuine all-round value. His projected 17.5 runs and 0.9 wickets offer balanced scoring potential.
Also consider:
- Shimron Hetmyer (WI) – 66.7% hit rate for 20+ runs, 80% in last 5 matches
- Ben Sears (NZ) – 83.3% hit rate for 1+ wicket, 100% in last 5 matches
- Shamar Joseph (WI) – 71.4% hit rate for 1+ wicket, 80% in last 5 matches
Conditions
Guyana in July brings warm, humid conditions typical of the Caribbean. Expect temperatures around 28-30 degrees with high humidity. No significant rain is forecast for match day, though afternoon thunderstorms are always a possibility in the region. Wind will be light, favouring neither pace nor spin bowling particularly.
Verdict and Betting Angles
The Statz projections are clear: New Zealand are the pick at 52.8% win probability, with West Indies at 45.2%. This is a lean verdict rather than a strong conviction, reflecting the competitive nature of T20 cricket and the bowler-friendly conditions that can level the playing field.
New Zealand’s higher ICC ranking, superior head-to-head record (9-2), and more consistent recent form all point to the visitors. However, West Indies’ home advantage and the pitch’s restrictive nature – which could blunt New Zealand’s batting firepower – keeps this contest competitive. The projected match total of 304 sits well above Providence’s historical average of 230, suggesting both sides will find runs if they get in.
The key will be the powerplay and middle overs. If West Indies can restrict New Zealand to under 160 in the first innings, they have every chance of chasing on a pitch that has historically favoured bowlers. Conversely, if New Zealand bat first and post 160+, their bowling attack – led by Sears and supported by Santner’s spin – should be able to defend.
Bet Builder Angles
Head to the Statz bet builder for real-time odds and hit rates on this fixture:
- Shimron Hetmyer 20+ runs – 66.7% season hit rate, 80% in last 5 matches. West Indies’ most consistent run-scorer on a pitch that demands aggression.
- Ben Sears 1+ wicket – 83.3% season hit rate, 100% in last 5 matches. New Zealand’s leading wicket-taker is in exceptional form.
- Shamar Joseph 1+ wicket – 71.4% season hit rate, 80% in last 5 matches. West Indies’ strike bowler on a surface that suits seam bowling.
- Ben Sears 2+ wickets – 66.7% season hit rate. Stepping up to two wickets still carries strong backing from the data on a bowler-friendly pitch.